Description
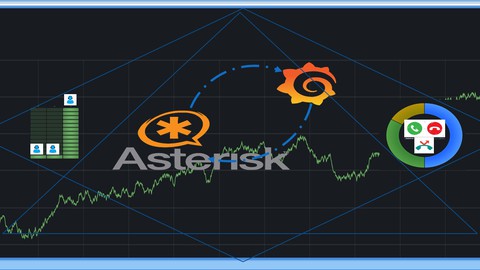
This course is all about transforming and visualizing the data generated by the Asterisk PBX. I am going to show you how you can create dashboards for different metrics in Asterisk using Grafana. I will also show you how you can monitor the performance of your Asterisk server. We are going to collect the data from the Asterisk server via Prometheus, Zabbix, and the database.
- Asterisk Server – Assumption Already setup
- Generate Data by setting up a LAB ( IVR System)
- Setup Application Servers (Zabbix, and Prometheus) for data collection
- Use SQL queries to retrieve Call Center and Agents KPIs from asterisk database
- Setup Grafana for Asterisk PBX metrics visualization
- Integrate Asterisk Server to Database server (Postgres)
- Integrate Asterisk with Prometheus
- Integrate Asterisk with Zabbix
- Integrate Grafana with Prometheus
- integrate Grafana with Zabbix
- Integrate Grafana with Database – in our case –Postgres database
- Create Visualizations on Grafana for different Asterisk Metrics by creating dashboards