Description
Hello everyone. Thank you for your interest in this course.
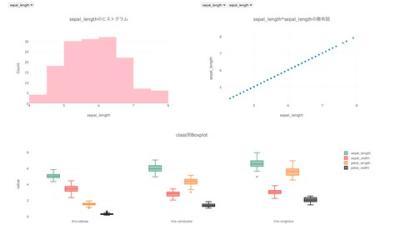
In this course, we use Django, a Python web framework, to develop a tool to aggregate CSV data
and visualize the results interactively with a browser.
By doing so, you will understand the Django framework and learn how to draw graphs with a browser.
I am Japanese and have previously created a Japanese version of this course.
In this time, I have created an English version of this lecture so that people from many different countries can study it.
My pronunciation may be difficult to understand because I am Japanese.
Therefore, I have added subtitles to this course for your reference.
Please refer to the materials and program zip file attached to you for each lecture, as needed.
Also, in order to make it easier for everyone to understand, this course provides videos on setting up the environment and programming.
In these videos, some of the expressions are in Japanese.
However, I think you will be able to fully understand the content of what we want to do.
The following is what you will learn in this course.
・Understand what it takes to create a web tool in Django.
・You will be able to understand the behavior of Django. (Understand how Django relates to HTML, CSS, pandas, javascript, jquery, plotlyjs)
・Understand how to lay out a web page using HTML and CSS.
・Understand how to process data in pandas.
・Understand how to create an interactive dashboard using javascript, jquery, and plotlyjs.
It is recommended for the following people.
・Those who want to use Django to create web tools.
・Those who are interested in data visualization.
・Experience with data aggregation in pandas, but have never made it into a web tool.